

Wake Safe and Research into Impact of Powerboats
Wake Safe and Research into Impact of Powerboats
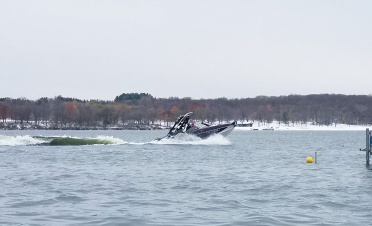
We have previously shared the results of a study by the St. Anthony Falls Lab at the U of M that documented the damage rapid acceleration and large wakes cause to shorelines and lake beds. One outcome of this research is a recommendation that wake boats limit their operation to depths greater than 20 feet and at least 500 feet from shore (nearly two football fields in length, if that's easier to visualize).
Our partners at Minnesota Lakes and Rivers (MLR) are offering to make maps for lake associations that depict the areas of a given lake that meet those two criteria. In the hopes of creating a map for the Chain lakes, we analyzed lake depths and concluded that there are effectively no areas on the Chain that meet the criteria.
While we support all on-the-water activities that the Chain enables, if you choose to create big wakes for surfing or skiing, please bear in mind the recommended minimum depths and distances to minimize the disruption of settled nutrients on the lake beds and damage to our shorelines.
* Wake surfing at least 500 feet from shore to reduce the wave energy impact on shorelines to the same level as a non-wake surf watercraft. Phase I Research: https://cse.umn.edu/safl/news/umn-researchers-study-waves-created-recreational-boats
* Operating in water depths of at least 20 feet to minimize subsurface ecological impact. Phase II Research: https://sites.google.com/umn.edu/healthywatersinitiative/phase-ii-research)
The power of Volunteers!
The power of Volunteers!
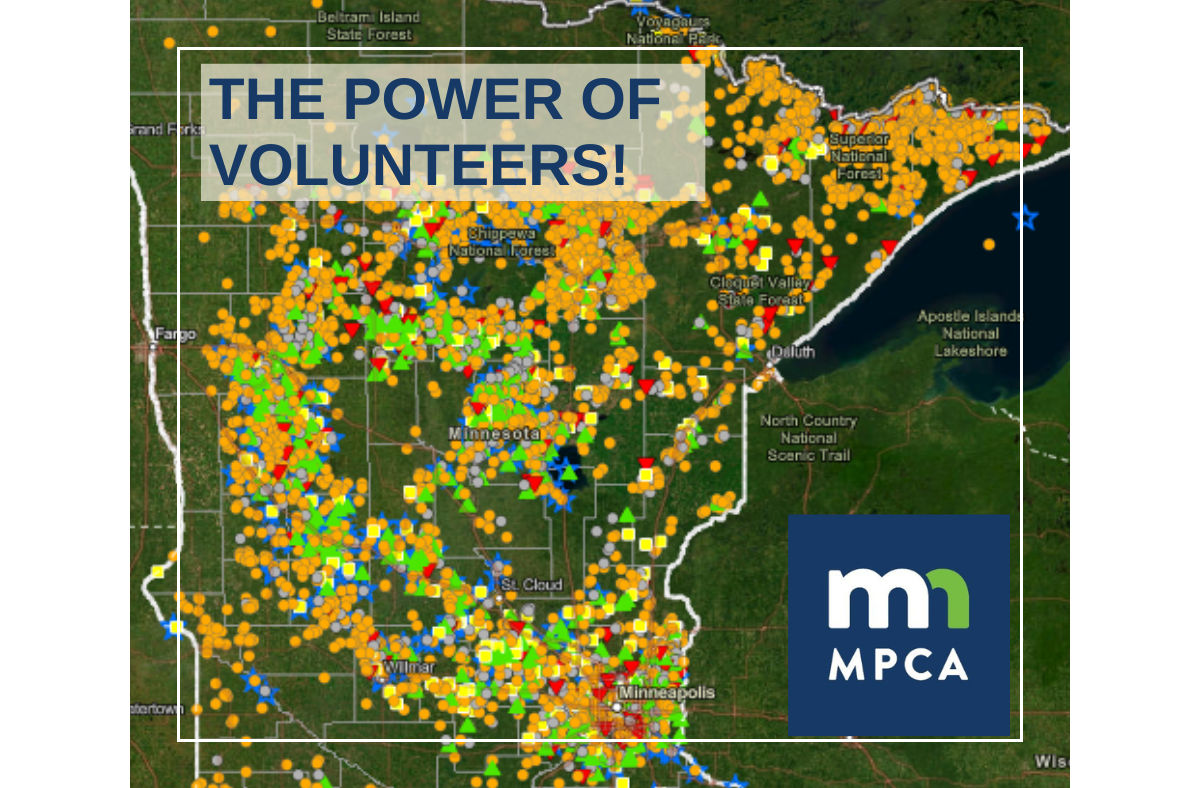
The power of volunteer-collected data is on full display in these state-wide online maps! An army of volunteers across the state collects data so that that we can learn about the health of our state's waters. https://experience.arcgis.com/experience/7be28eb70b354e4d92e47fd14ab405df
Click on any lake displayed on the map to see the results of the most recently water clarity trend analysis. Trends use all historical data per stream site or across a full lake to determine if water clarity is increasing, decreasing or staying the same. Not all lake or stream sites have enough data to determine if a trend is present.
If you want to learn more about volunteering to monitor your lake, go to https://www.pca.state.mn.us/get-engaged/volunteer-water-monitoring
Trends in Minnesota’s Lakes and Rivers
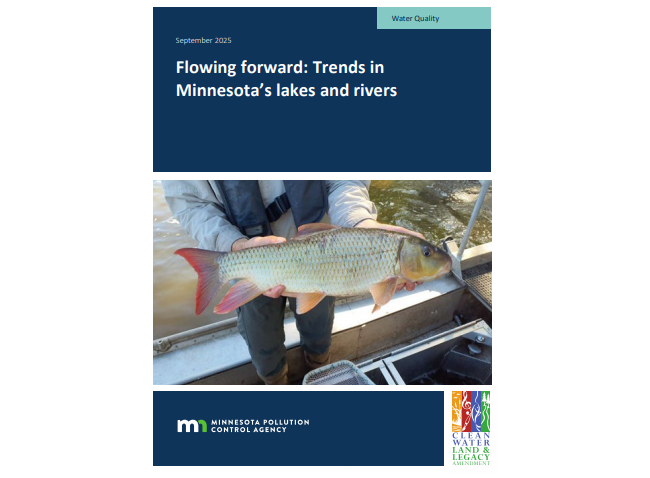
MPCA Flowing Forward: Trends in Minnesota’s Lakes and Rivers
🌊 Big news for Minnesota’s waters! 🚣♂️
The latest 2025 report from the Minnesota Pollution Control Agency (MPCA) shows that our collective efforts to protect our lakes and rivers are paying off. Here’s the breakdown on how our waters are flowing forward:
Life is Thriving: Fish and bug communities in our rivers and streams are showing statistically significant improvements! 🐟🐜
Cleaner Water: Phosphorus levels in large rivers are mostly stable or declining, and nearly a third of monitored lakes show improving water clarity. ✨
Success Stories: Since 2002, 95 lakes and river segments have been healthy enough to be removed from the impaired waters list! 🏆
The Long Game: Real restoration takes time (often a decade or more), but programs like the Clean Water Fund are making a measurable difference through better land management and community action. 🌱
While challenges like "forever chemicals" (PFAS) and nitrates remain, the trend is clear: Minnesota’s water is getting healthier. 💧
Check out the full report to see how our watershed is doing, and visit the Water Quality page to see data on our own Chain of Lakes.
MPCA Volunteer Monitoring Reports and Data
MPCA Volunteer Monitoring Reports and Data
🌊 Curious about the health of your favorite Minnesota lake or stream? 🛶
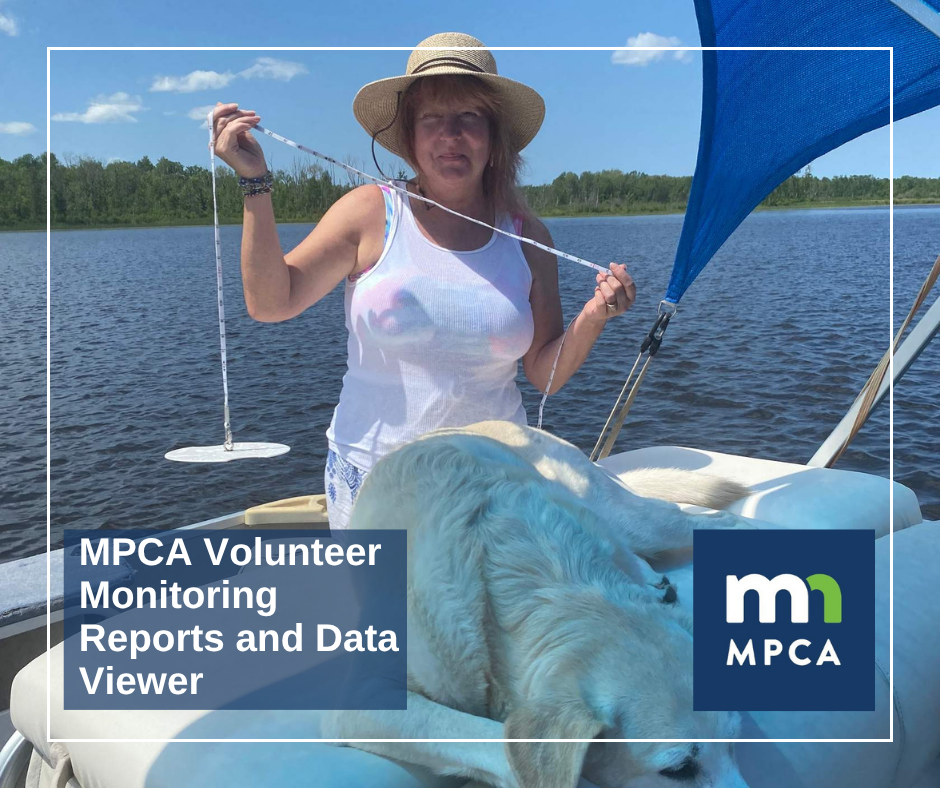
The Minnesota Pollution Control Agency (MPCA) has an incredible Volunteer Monitoring Reports and Data portal that puts decades of community-driven science right at your fingertips! Here are the key features you can explore:
📈 Transparency Trends: See how water clarity has changed over time with easy-to-read charts. This data helps identify if a lake's health is improving or declining.
📊 Annual Data Summaries: Get an in-depth look at the most recent monitoring season, including site-specific statistics and user perceptions of water quality.
🗺️ Interactive Maps: Use the map tool to find specific monitoring stations or see which lakes and streams still need a volunteer "eyes on the water".
🏆 Aquatic Recreation Assessments: Learn how well a water body supports activities like swimming and wading based on nutrient levels and sediment.
❄️ Lake Ice Reporting: Check "ice-in" and "ice-out" dates to track how shorter winters are impacting our local ecosystems.
Did you know? Over 1,000 volunteers across the state contribute this vital data, often providing the only information available for certain bodies of water.
Explore the data or sign up to become a monitor yourself! 🔗 MPCA Volunteer Monitoring
Check out the great work by our Water Quality Team - they could use an extra hand!
2025 SRCLA Lake Monitoring Report
2025 SRCLA Lake Monitoring Report
The 2025 SRCLA Lake Monitoring report has been compiled by Abi Borgerding of the Sauk River Watershed District (SRWD). The SRWD and the SRCLA board have worked together for decades on our shared goal of improving water quality. This year's report summarizes data taken from periodic water samples from six lakes on the Chain: Horseshoe, Cedar Island, Bolfing, Krays, Knaus and Schneider. Both flowage and non-flowage lakes are deliberately sampled to provide a complete picture of the health of the Chain.
Click here to read the full report. If you have any questions about the report, please contact our Water Quality lead, Jon Folkedahl, at folkedahljon@gmail.com.